Download Access File:
Report Generator to Excel with Formatting
(for Access 2010 and Up)
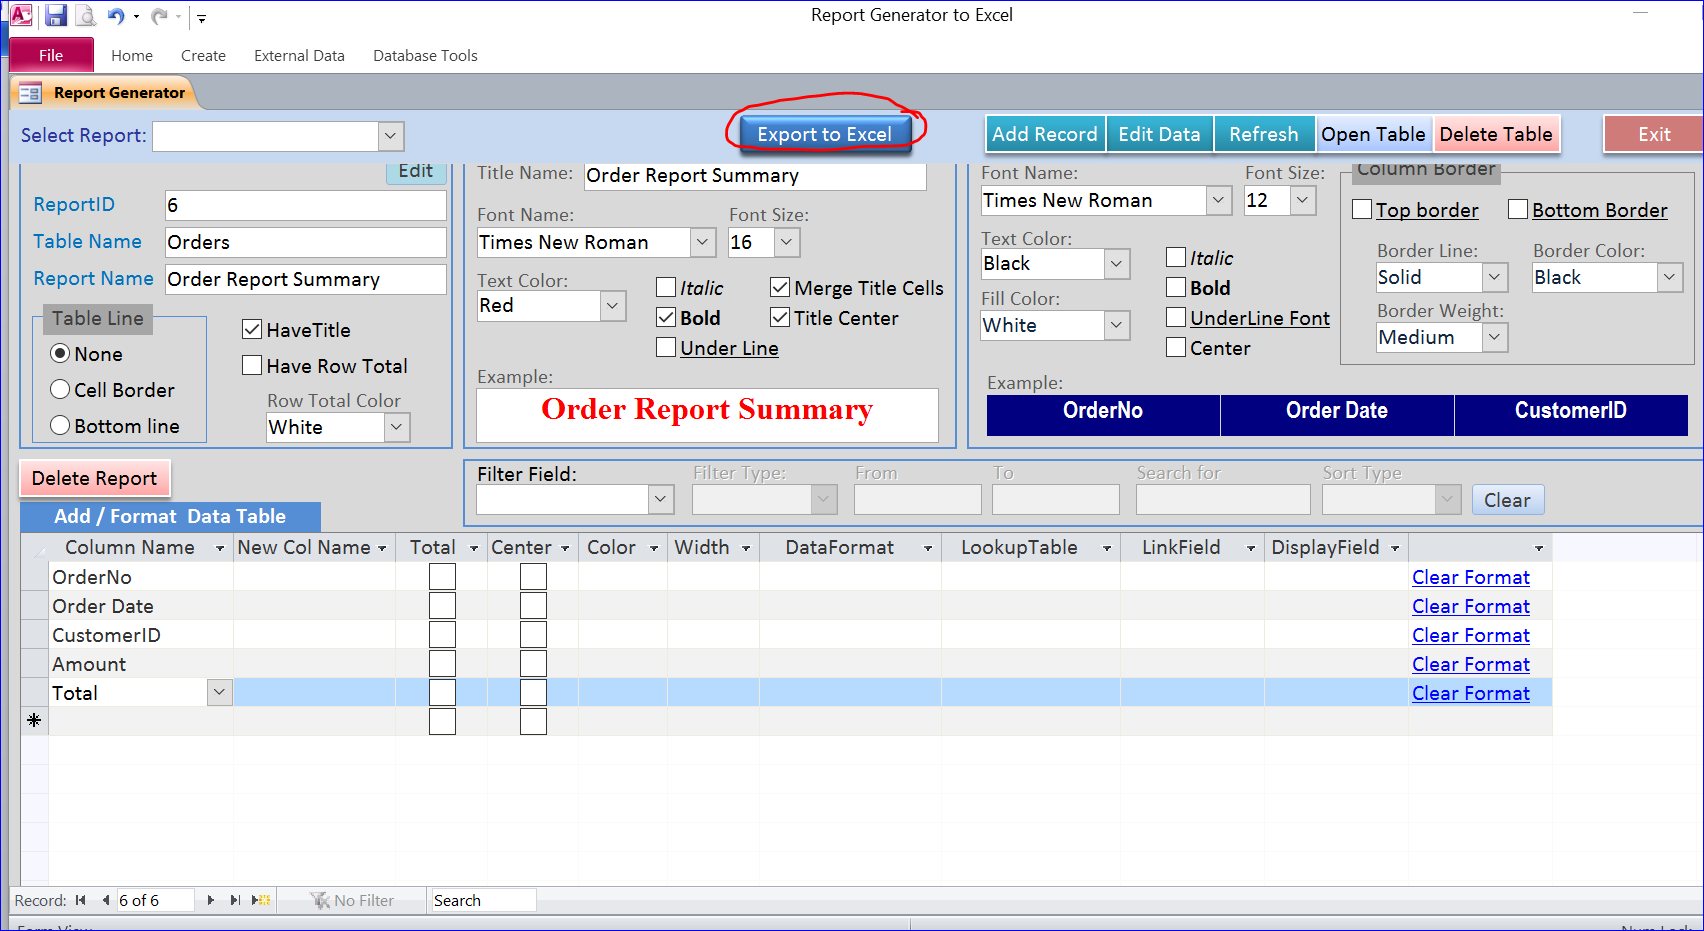
This is a MS Access application that is used to generate a report and export to MS Excel. It is ready to use. You can export data from table to MS Excel with your own format. You can modify the format of report on Access form before exporting to Excel. After you update all formatting, you can click
There are two version of this Access application.
- Use Only version ($14.99). This version is for use only. The form is locked for edit. You can insert table from another database to this database and generate report to Excel. However, you cannot edit the form or cannot open the design view of this form to see the VB code. This version is suitable to generate report to Excel only with the criteria or formatting as described below.
- Editable version ($24.99). This version is for the developers who want to learn more and how it works. They can able to view the form design and see the code behind all functions. They can implement it to their own database.
Highlight functions in this application file include:
#1. Import and Select Table for Report
First you will need to insert or link tables or data from another database into this database by using the External Data menu. You can import or link data from another Access, Excel, or ODBC Database.
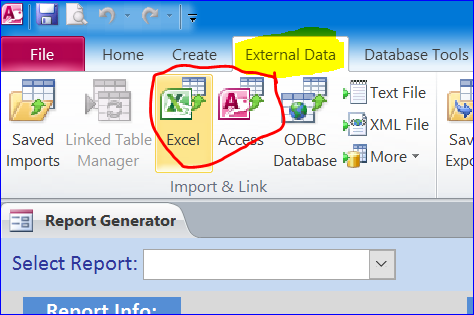
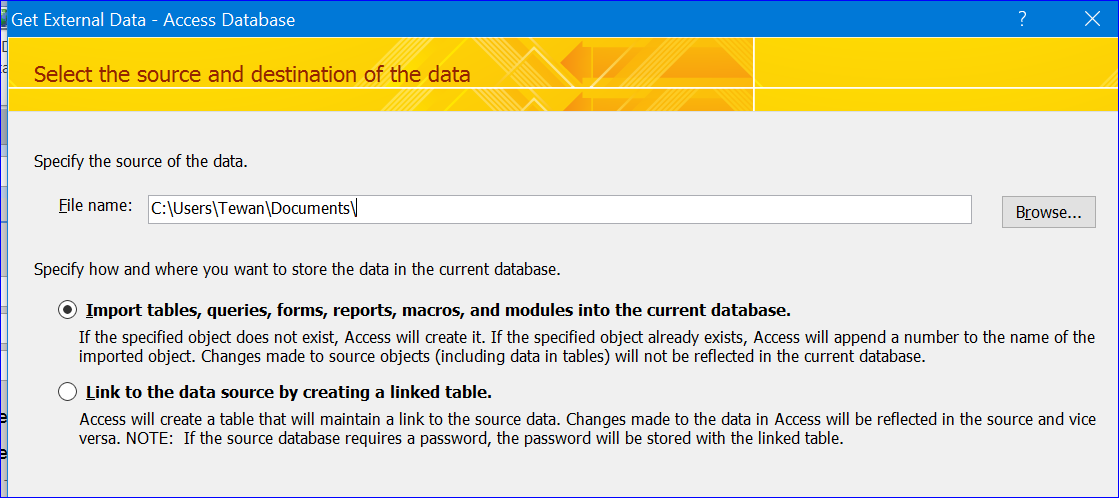
After you click the External icon on the menu bar then it will open the Get External Data Wizard. You have an option to import a table or data from another file or you can just link it to another file. Follow all steps on the wizard to finish.
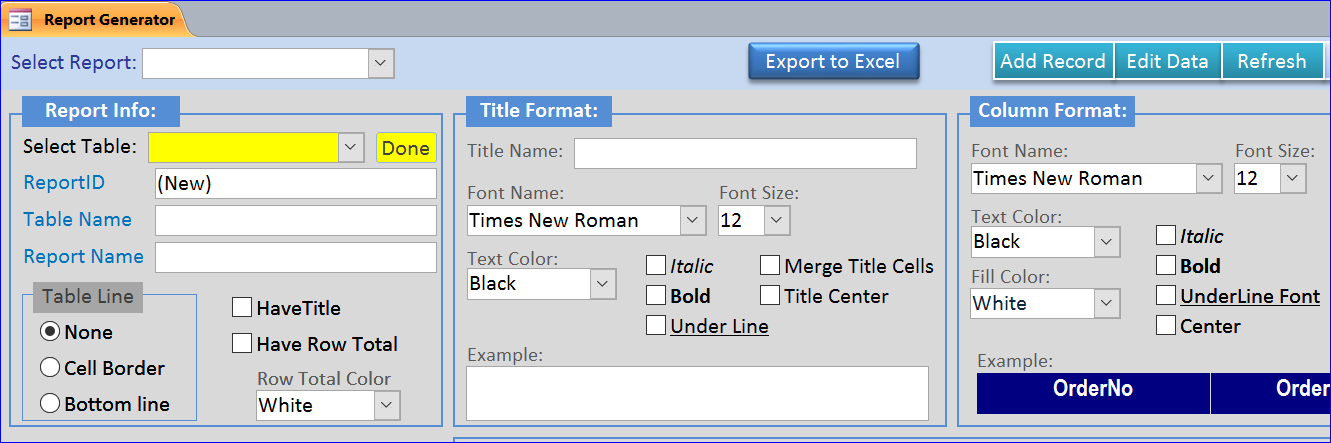
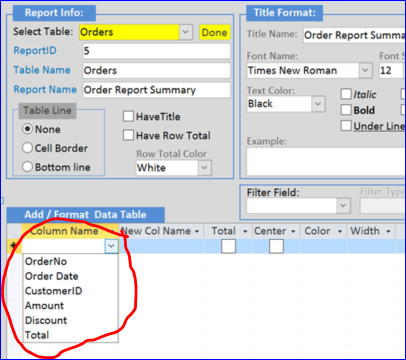
After you insert or link tables/data, click on the Add Record button on top of form to add a new record or new report. The Select Table combo box will display under the Report Info section. The field color is yellow and set focus to select a table from the drop-down list.
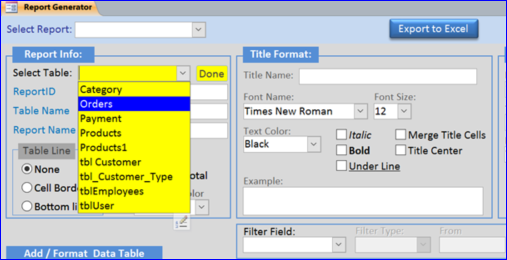
After you selected a table from the list, the Table Name field will auto update to the name of table you just selected. Now you can start enter the information for your new report by starting with a Report Name below the Table Name field. Also now you can start select the field name from the combo box drop-down under the Column Name under the Add/Format Data Table section to export to Excel.
#2. Format Report Title
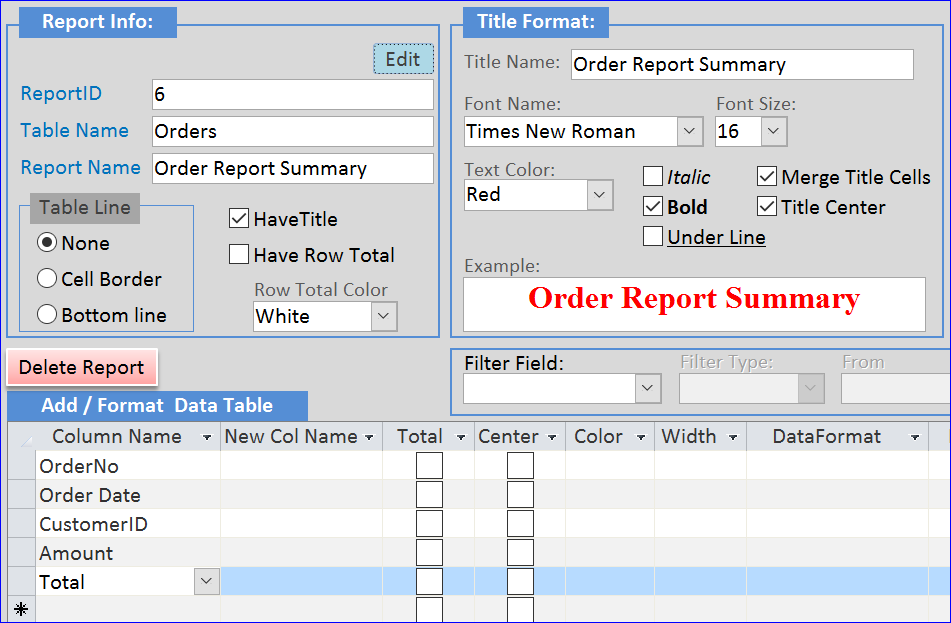
After you enter the Report Name field under the Report Info section, the Title Name field under the Title Format section will auto populate with same name. The Font Name, Font Size and Text Color will auto populate from a default setting when you click on Add Record button. After you update or change setting under the Title Format section, the Example box will display the title name with current format that will display when you export to Excel. You will see how the title looks like before exporting.
Note: You need to check box on Have Title check box in order to display the title on excel.
Format Title Example #1
- Font name = Times New Roman
- Font size = 16
- Text color = Red
- Text Bold
- Merge all columns and set Title center
Excel Result of Format Title Example #1
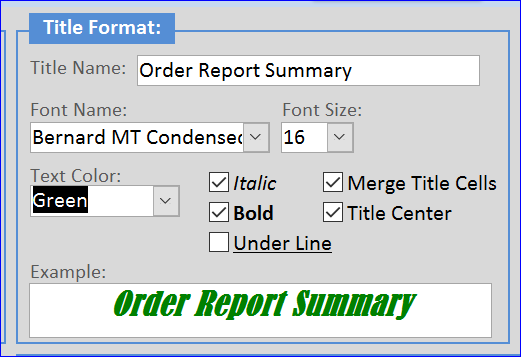
Format Title Example #2
- Font name =Bernard MT Condensed
- Font size = 16
- Text color = Green
- Text Bold and Atalic
- Merge all columns and set Title center
Excel Result Format Title Example #2
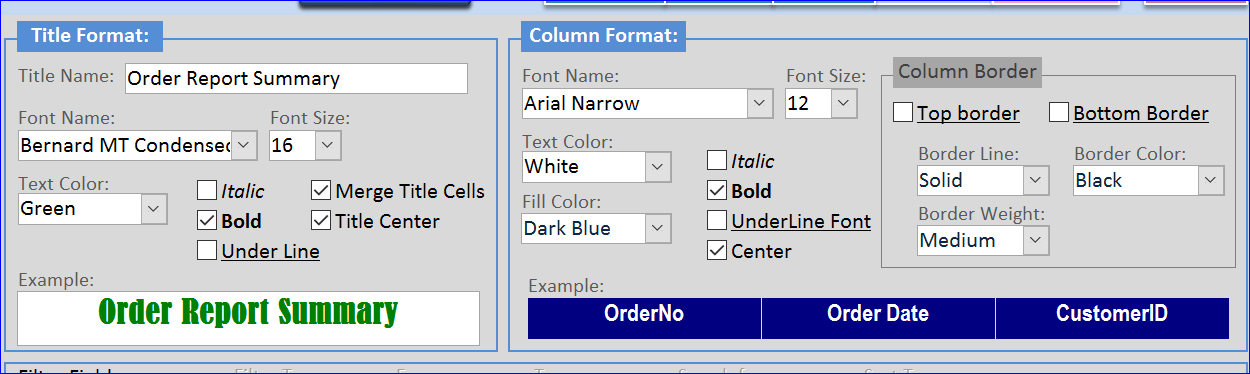
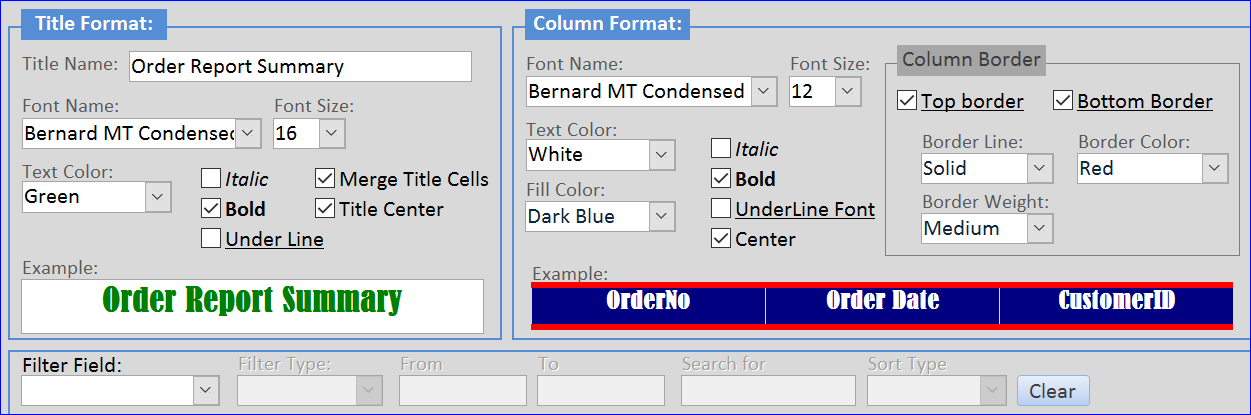
#3. Format Column Head
Under the Column Format section, you can change a font name, font size, text color, fill/cell color, center alignment, text bold, underline, or font italic. You can also show top or bottom line border by checking the Top border and/or Bottom border check box. Every time you change formatting the example of column will display on the Example box at the bottom of Column Format section as shown in the picture below. By this way, you will see how the column head looks like in Excel.
Format Column Head Example #1
- Font name = Arial Narrow
- Font size = 12
- Text color = White
- Text Bold
- Align Center
- Fill/Cell color = Dark Blue
Excel Result of Format Column Head Example #1
Format Column Head Example #2
- Font name = Bernard MT Condensed
- Font size = 12
- Text color = White
- Text Bold
- Align Center
- Fill/Cell color = Dark Blue
- Has both Top border and Bottom border line
- Border line is solid with red color and medium line weight
Excel Result of Format Column Head Example #2
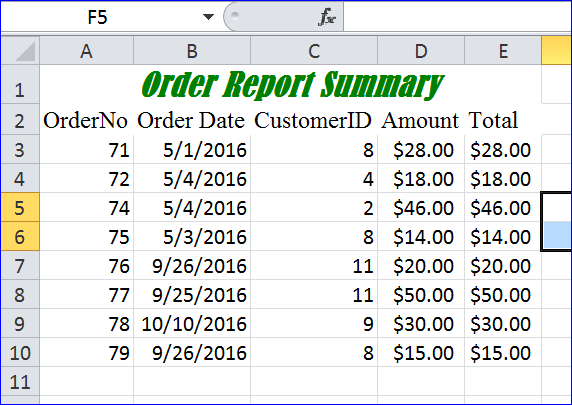
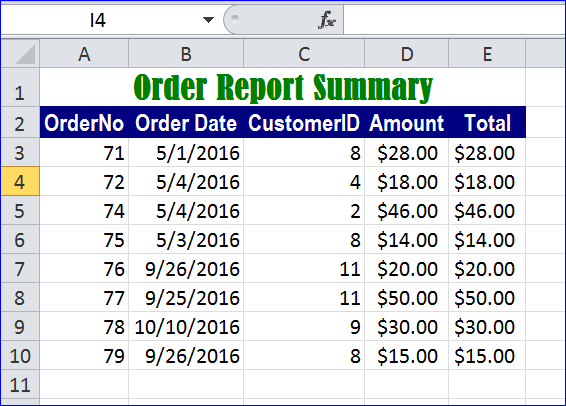
#4. Format Report Body/Data Table
Under the Body/Data Table section of report, you can add a border to all data cells or you can just add a bottom line for each cell. The color of border is pre-set to black color.
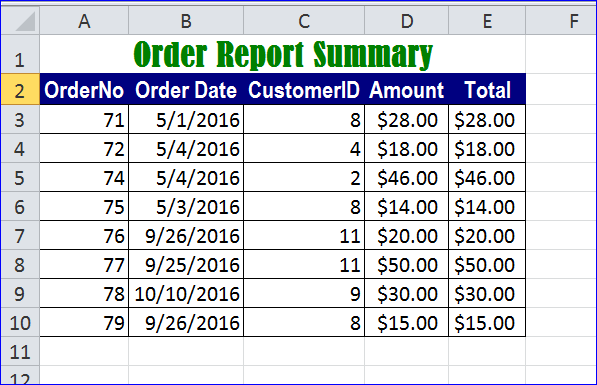
Format Body/Data Table Example #1
- Have Title: checked
- Table Line: Cell Border
Excel Result of Format Body/Data Table Example #1
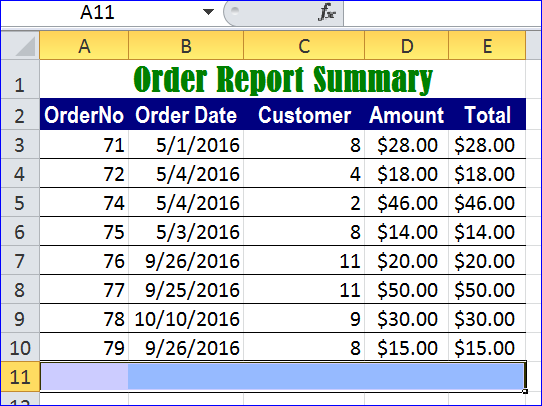
Format Body/Data Table Example #2
- Have Title: checked
- Table Line: Bottom line
- Have Row Total: checked
- Row Total color: Ice Blue
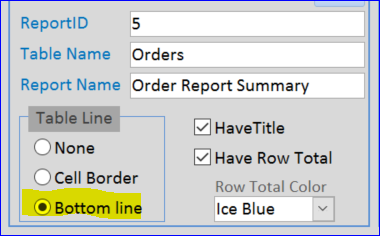
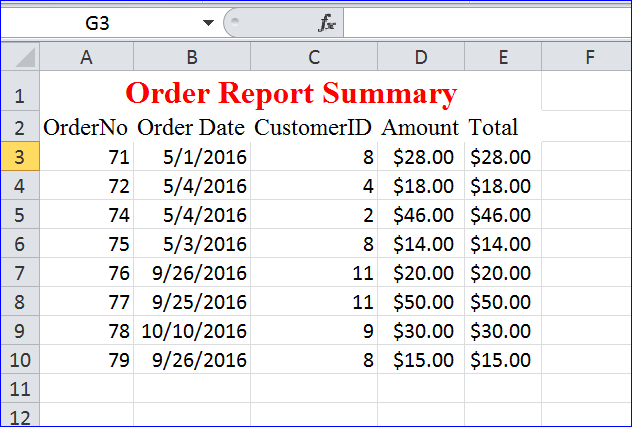
Excel Result of Format Body/Data Table Example #2
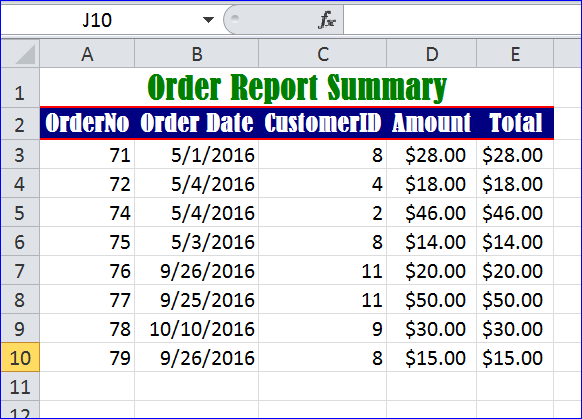
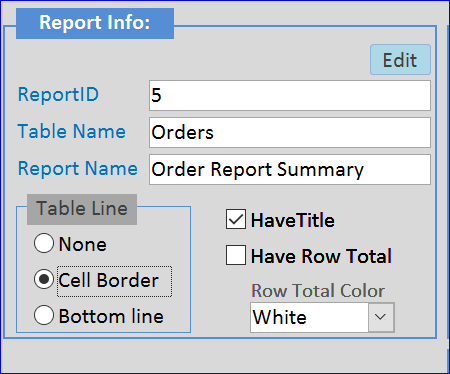
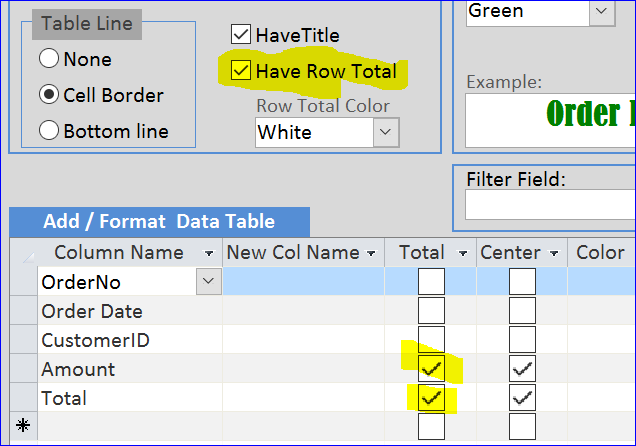
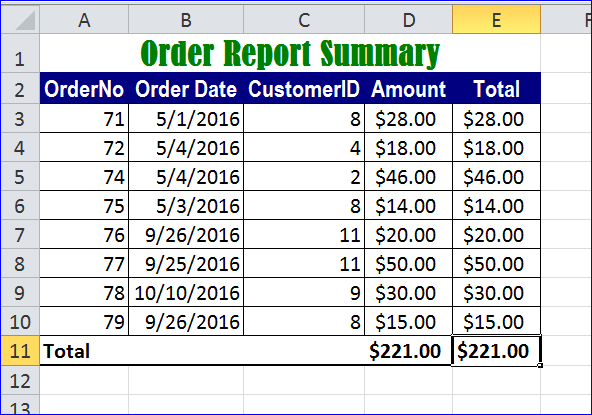
Format Body/Data Table Example #3
- Have Title: checked
- Table Line: Cell Border
- Have Row Total: checked
- Row Total color: White
- Check on Total on the Amount column and Total column
- Check on Center alignment on the Amount and Total column
Excel Result of Format Body/Data Table Example #3
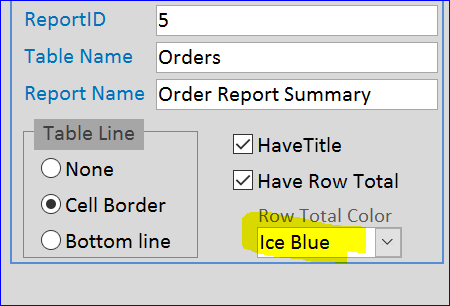
Format Body/Data Table Example #4
- Have Title: checked
- Table Line: Cell Border
- Have Row Total: checked
- Row Total color: Ice Blue
- Check on Total on the Amount column and Total column
- Check on Center alignment on the Amount and Total column
Excel Result of Format Body/Data Table Example #4
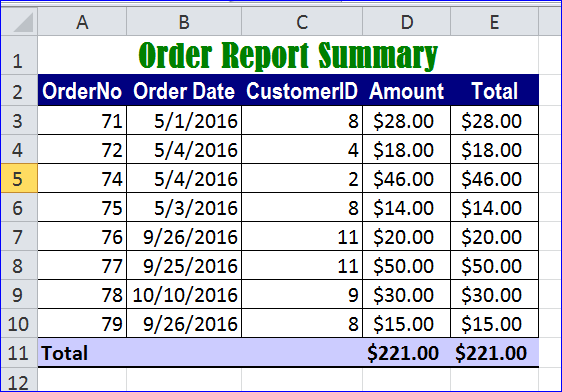
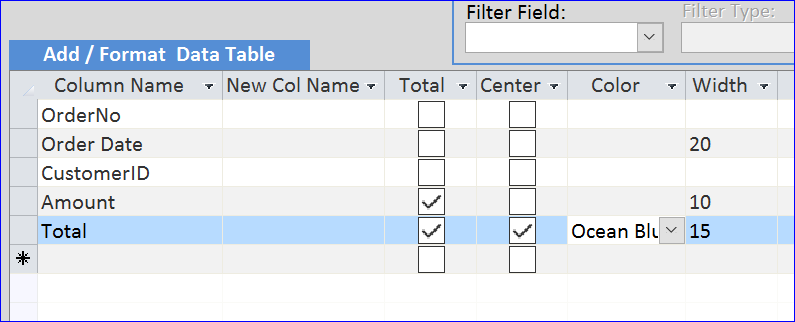
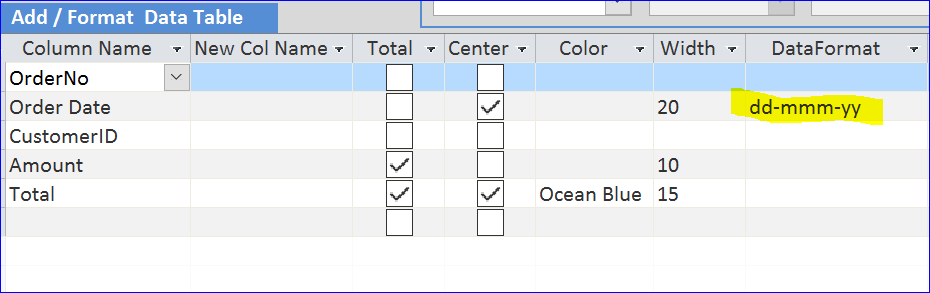
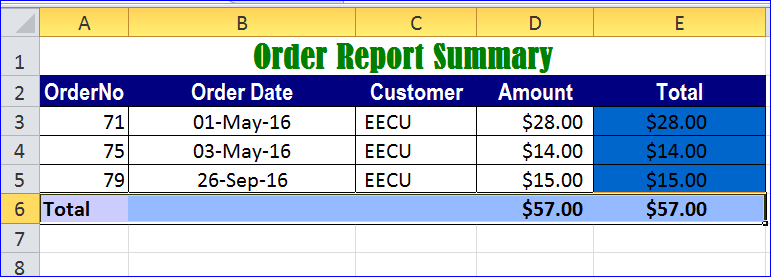
Format Body/Data Table Example #5
- Check on Total on the Amount column and Total column
- Check on Center alignment on the Total column
- Select Ocean Blue color for Total column
- Enter a column width with 20 for Order Date column, 10 for Amount column, and 15 for Total column
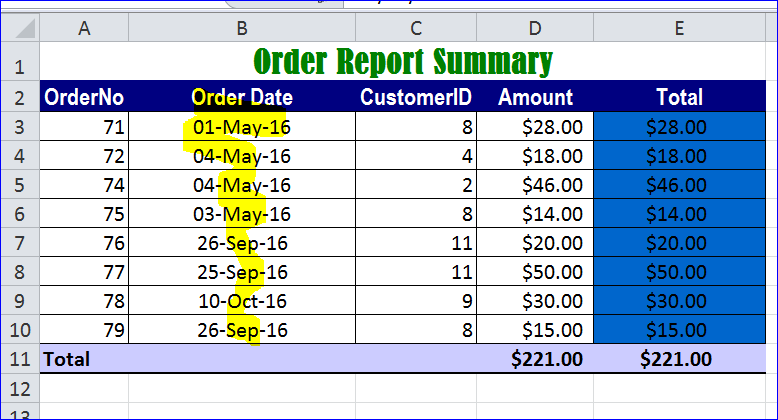
Excel Result of Format Body/Data Table Example #5
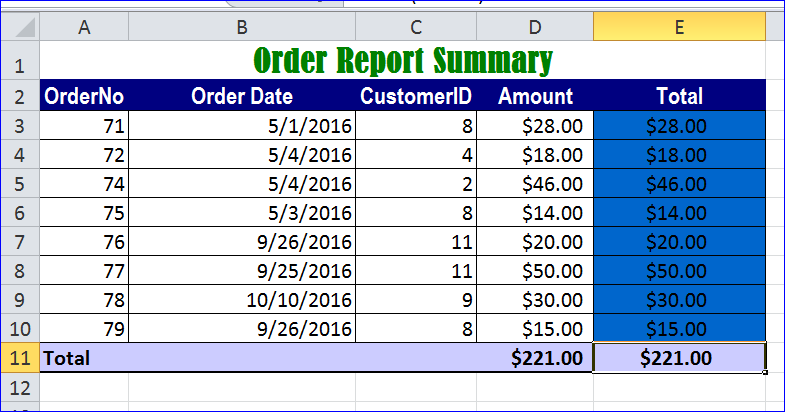
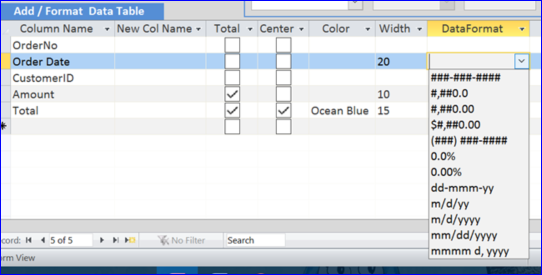
Format Body/Data Table Example #6
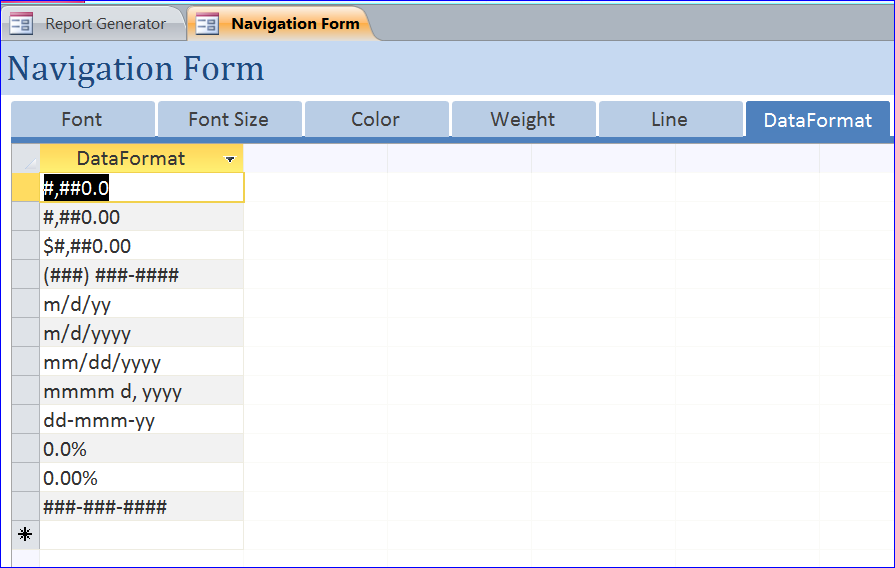
There are many types of format that can be selected for each field (excel column) under the DataFormat column as shown in the picture below. You just select the type that corresponds to your data on each field. You can also add your new format to the table then it will display in the drop-down list of DataFormat drop-down list.
In this example, the additional format is updated for Order Date column by setting to Center and selecting the format for date as dd-mmm-yy (like 02-Jan-17).
Excel Result of Format Body/Data Table Example #6
Format Body/Data Table Example #7
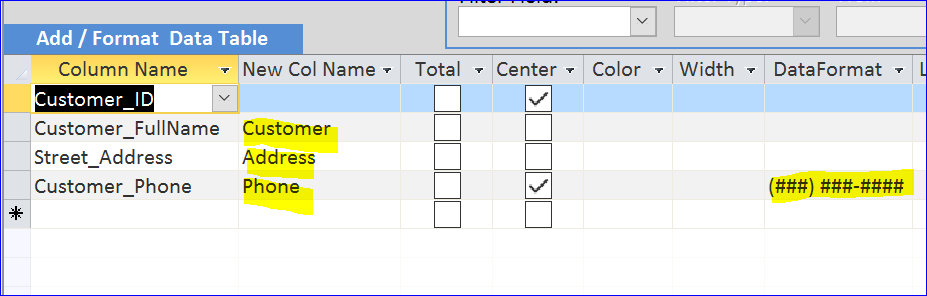
You will see the original field name in table are Customer_FullName, Stree_Address, and Customer_Phone. These field names will be showing in Excel after exporting. However, you can change these field names to be a new column names in Excel.
- Customer_FullName => Customer
- Stree_Address => Address
- Customer_Phone => Phone
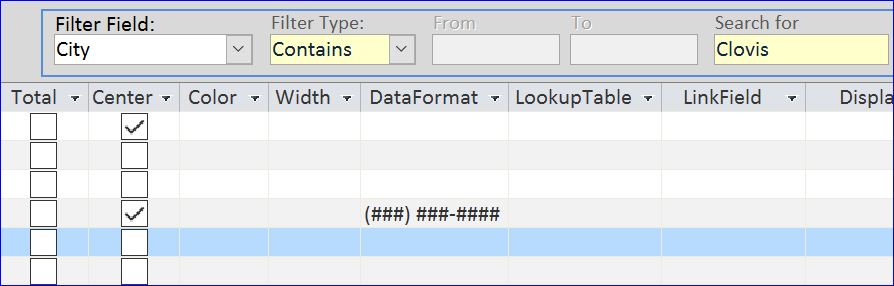
In this example, I also select a format for a phone number as (###) ###-#### (like (559) 524-8854). If there is no selection of DataFormat, the phone number will display like 5595248854.
Example of exporting without changing the column name and without formatting on phone number.
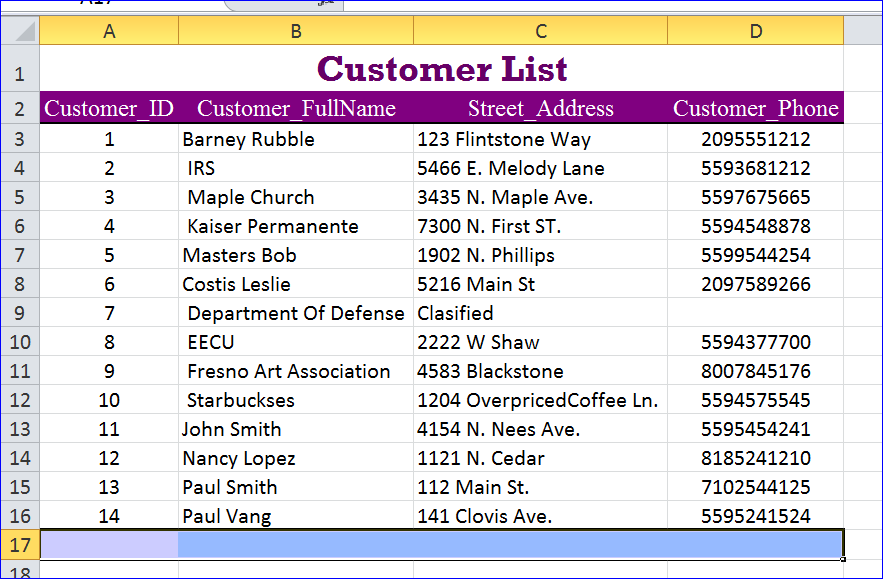
Excel Result of Format Body/Data Table Example #7
Format Body/Data Table Example #8
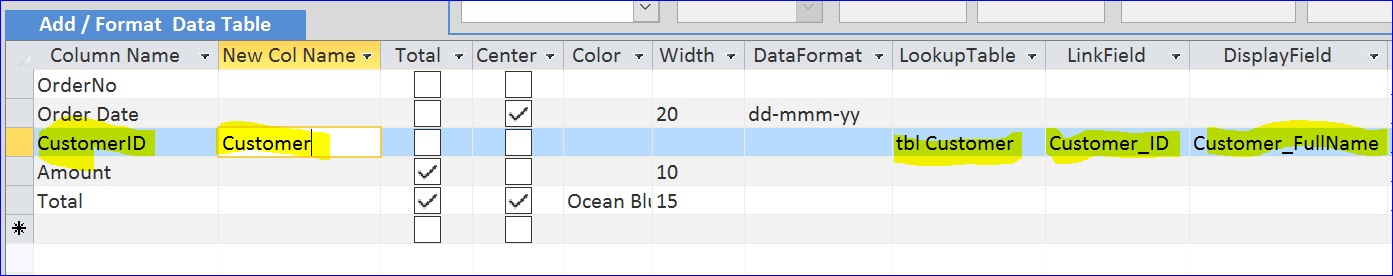
From the example #6 above, you will see the CustomerID is listed as 8,4,2,… for each order number because the customerID as a lookup field that links to the Customer table. The CustomerID (integer) in the Order table stores only the CustomerID (number) of customer. So it display as number 8,4,2,… in this table.
This application provides you a LookupTable, LinkField, and DisplayField that you can select from the drop-down list to link to the customer name to the CustomerID in the Order table.
For example below:
- I change a column name from CustomerID to Customer.
- On CustomerID field, I select the tbl Customer table as a original table of CustomerID under the LookupTable field. After selecting the table name from the LookupTable, the LinkField and DisplayField will display the list of all fields of that table.
- I select Customer_ID field under the LinkField as this field is linking to the CustomerID in the Order table.
- I aslo select Customer_FullName field to make it disaply a customer full name in Excel column. The Customer column in excel will display a customer full name as shown below.
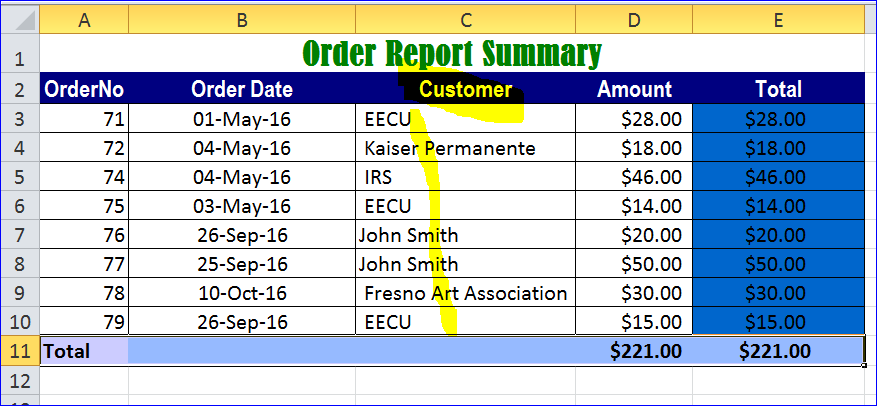
Excel Result of Format Body/Data Table Example #8
#5. Filter Field
This Access application also has ability to filter data before exporting to Excel. There are basic four different types of filters that I programmed into this application: equal (=), contains (like), From/To (for date or number), and Sort (A-Z, Z-A).
Filter Example 1: = Filter Type
The Search for box will be enabled when the filter type = or Contains is selected. The From and To box will be disabled.
- Filter Field: CustomerID
- Filter Type: =
- Search for: 8
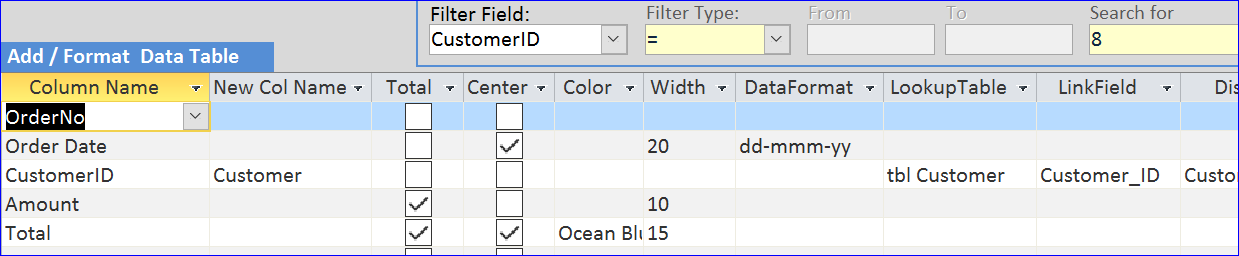
Excel Result of Filter Example 1
There are 3 orders for customer EECU (CustomerID = 8).
Filter Example 2: Contains Filter Type (as whole)
- Filter Field: City
- Filter Type: Contains
- Search for: Clovis (as a full name of city)
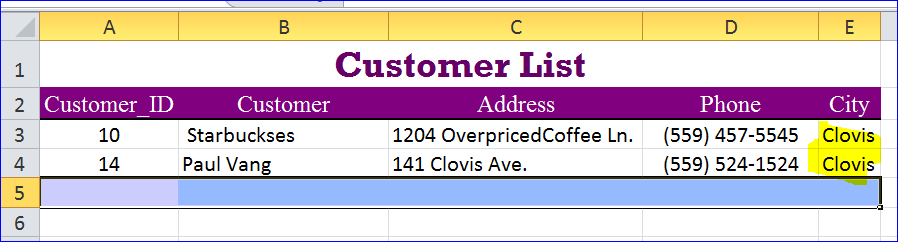
Excel Result of Filter Example 2
There are 2 customers who live in Clovis city.
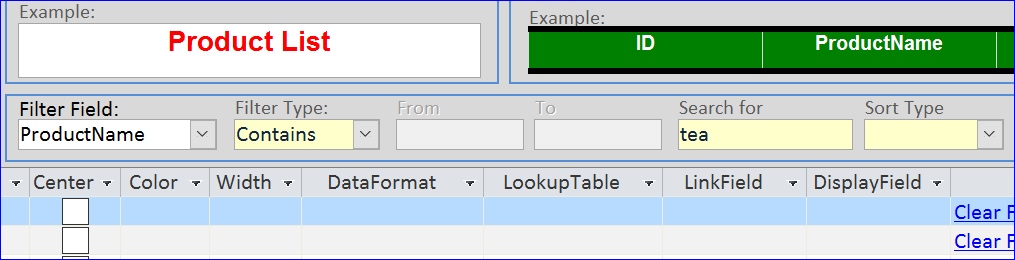
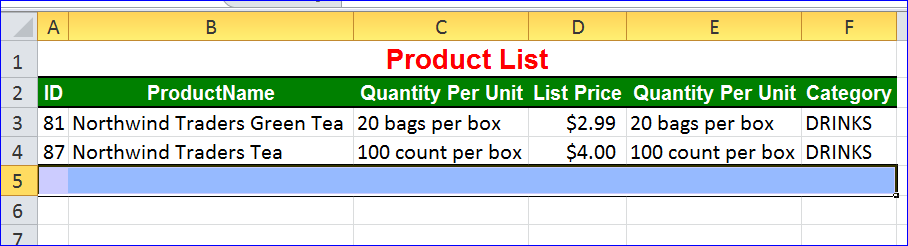
Filter Example 3: Contains Filter Type ( as part)
- Filter Field: ProductName
- Filter Type: Contains
- Search for: tea (as a part of product name)
Excel Result of Filter Example 3
There are 2 products that have name that contains a word “tea”.
Filter Example 4: From/To Filter Type (for date)
The From and To box will be enabled only the filter type From/To is selected. The Search for box will be disabled if the filter type From/To is selected.
- Filter Field: Order Date
- Filter Type: From/To
- From: 5/1/16 To: 12/1/16
- Sort Type: A-Z
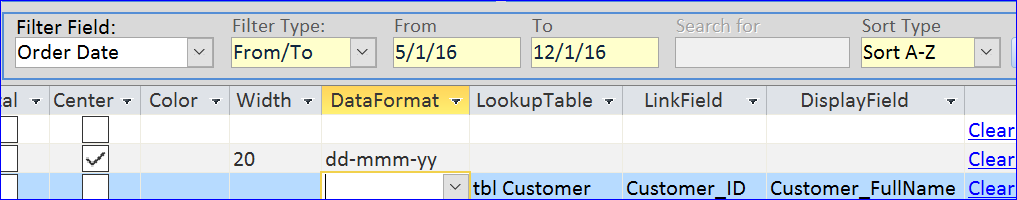
Excel Result of Filter Example 4
In the Orders table, there are 8 orders from 5/1/16 – 12/1/16. The list is ordered from the older date to new date.
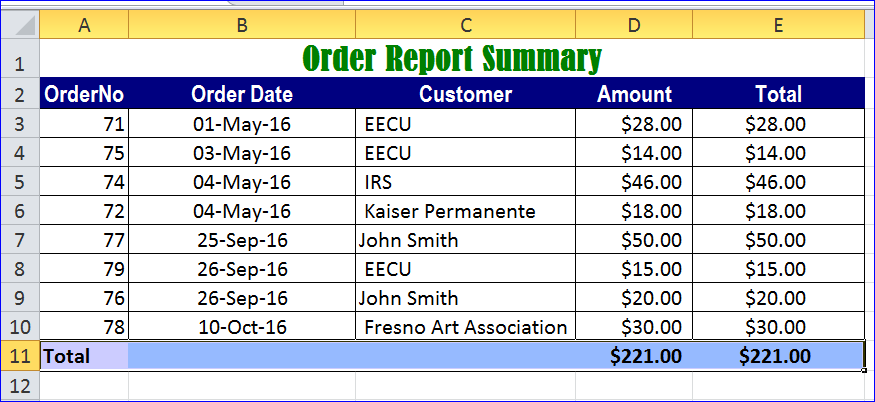
Filter Example 5: From/To Filter Type (for number)
The Sort Type is always enabled for sorting. The From/To filter type also can be used to sort the value of field by number as shown below.
- Filter Field: Total
- Filter Type: From/To
- From: 20 To: 50
- Sort Type: Z-A (more to less)
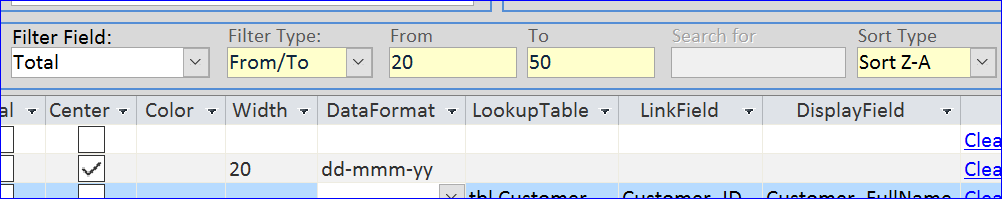
Excel Result of Filter Example 5
In the Orders table, there are 5 orders that have total order from $20-$50. The list is ordered from a large amount to small amount of total.
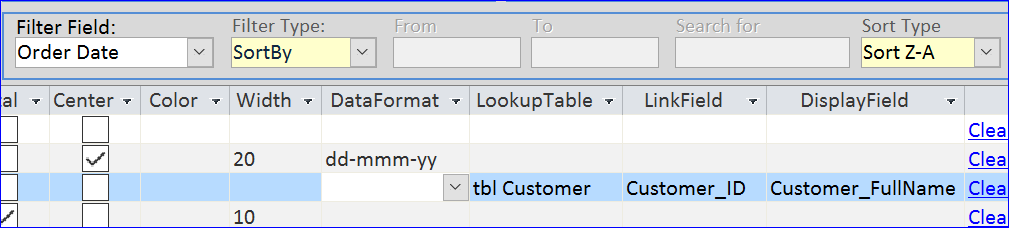
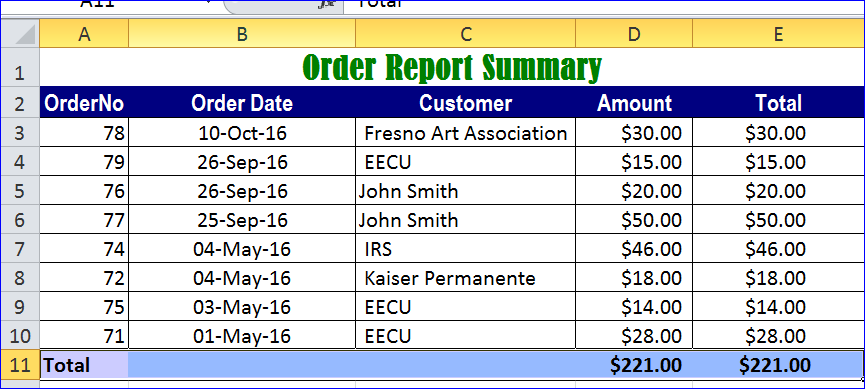
Filter Example 6: SortBy Filter Type (sort date)
The From,To, and Search for box will be disabled when the filter type SortBy is selected. The user will need to select either Sort A-Z or Sort Z-A under the Sort Type drop-down box. The report will display all records from the table and sort from the most current date to old date.
- Filter Field: Order Date
- Filter Type: SortBy
- Sort Type: Z-A (most current date comes first)
Excel Result of Filter Example 6
All orders from the Orders table are sorted from the most current date to older date.
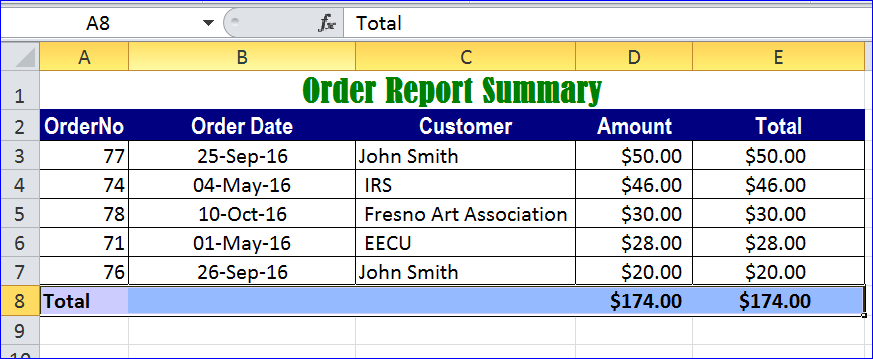
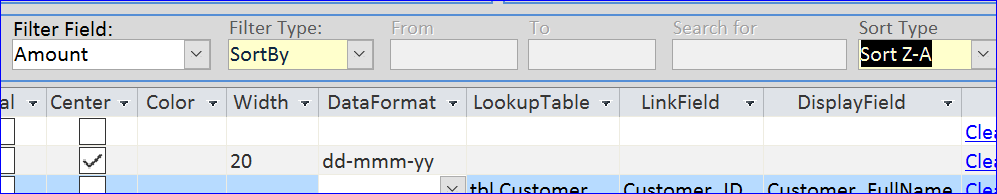
Filter Example 7: SortBy Filter Type (sort number)
The report will display all records from the Orders table and sort the total order amount from more to less.
- Filter Field: Amount
- Filter Type: SortBy
- Sort Type: Z-A (order from total more to less )
Excel Result of Filter Example 7
#6. Open Table
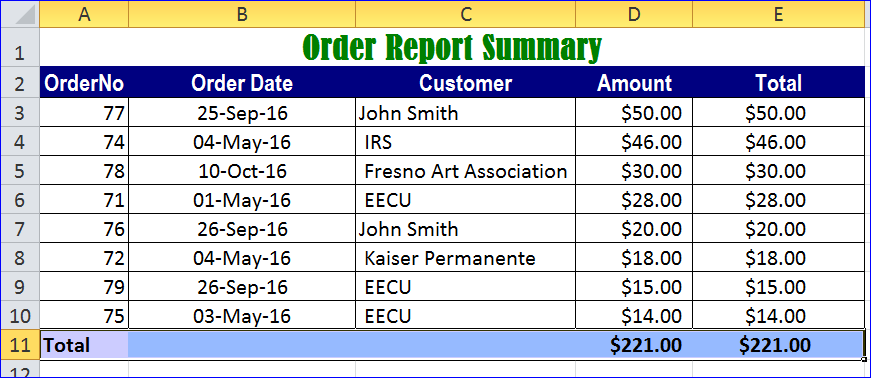
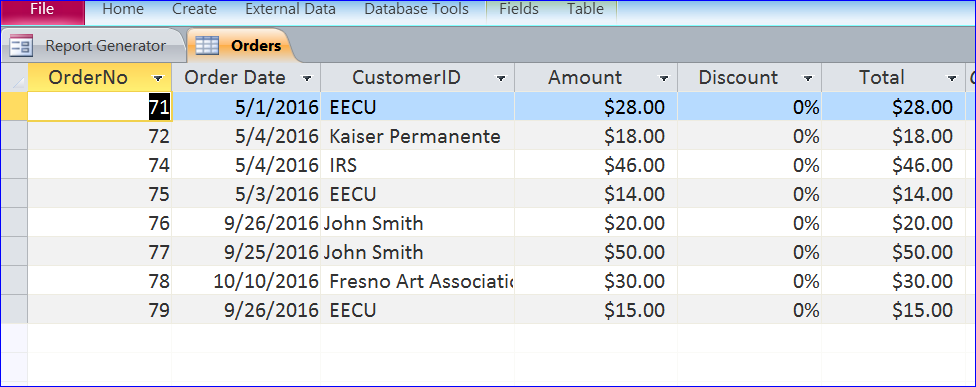
This Access application also provides an Open Table button to open the table of current record to see all data or type of data on the table of selected report. It will open in Read-Only mode. The user cannot change any data in the table. In this example, I select Orders table for report. So it will open the Orders table in the data sheet format as shown below.
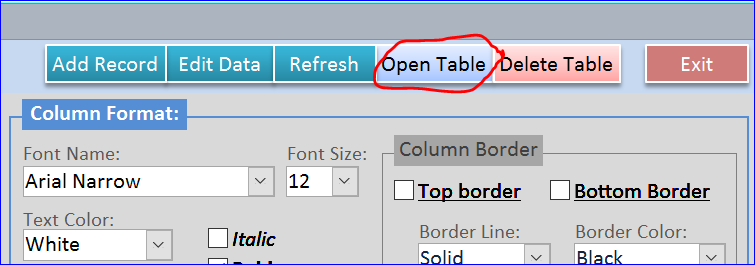
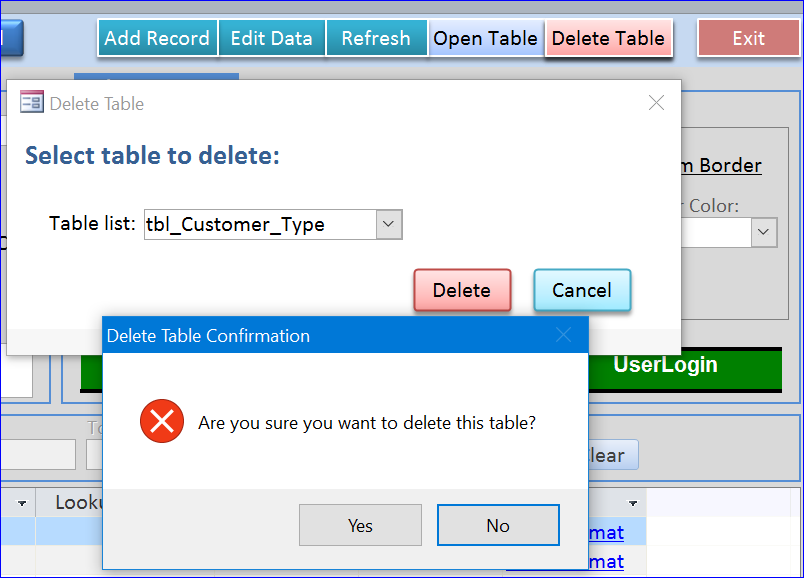
#7. Delete Table
This Access application also provides a Delete Table button to delete the table that is not needed anymore. After click the Delete Table button, it will open a form that provides a drop-down list of the table to select. The tables that are used for this application will not display on the drop-down list.
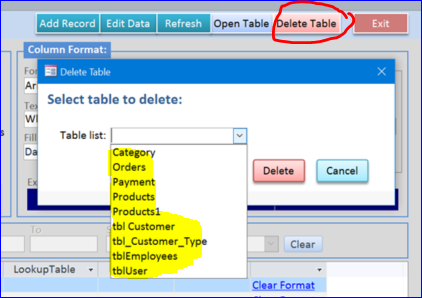
After the user selects the table from the list and click Delete button, a pop-up message will display and give one more chance to the user to delete this table or not. The program will delete the table after the user clicks Yes. The default answer of message is No to prevent an error clicking.
#8. Add/Edit Some Data
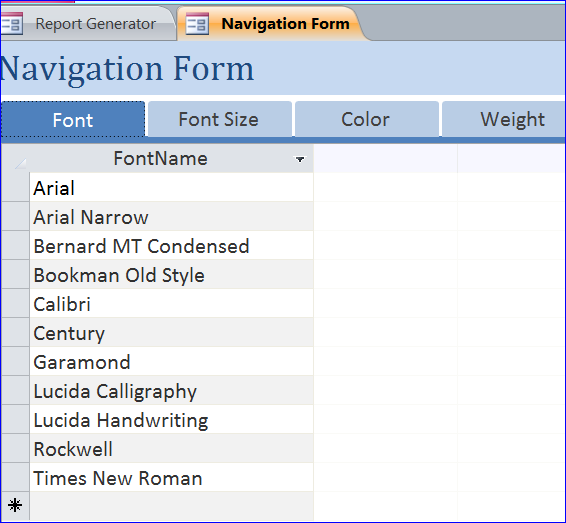
After you click on the Edit Data button on top of form, it will open the Navigation Form with many tabs of data that you can add or edit. The user can change, add, update the font name, font size, color, line weight, and data format type. In the example below, there are 11 font names that are pre-loaded for you. The user can add more font name as they want.
Under the DataFormat tab, the user can add more data format types as they want.
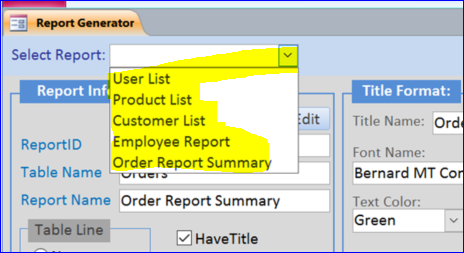
#9. Select Report
On the top left hand corner, you can select the report from the Select Report drop-down list. Every report that you created will display on this list. You can create many reports as you want. You can create many reports from one table depending on what style you want to show on Excel.
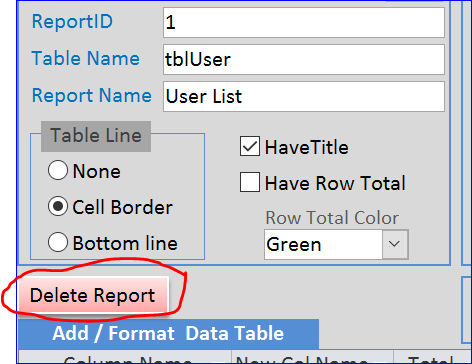
#10. Delete Report
You can also delete the report by clicking on the Delete Report button below the Report Info section as shown in the picture below. You will need to open report first before deleting that report.
#11. Add New Report
You can add a new report by clicking on Add Record button on top of form. It will open a blank form to entry new report information. The Select Table box will be highlighted in yellow. You can select a table from the Select Table drop-down list to create a new report then complete all information on all sections.