How to Use a Report Wizard
The MS Access has provided many different types of tools to create a report. There are many icons for creating a report under the Create menu. In this How To, I will show how to use the Report Wizard to create report.
Report Wizard:
MS Access has provided the easiest method to create a report in Access is to use the Report Wizard. It guides you step by step through arranging and selecting which data to display on a report.
To use the Report Wizard in Access, follow these steps below:
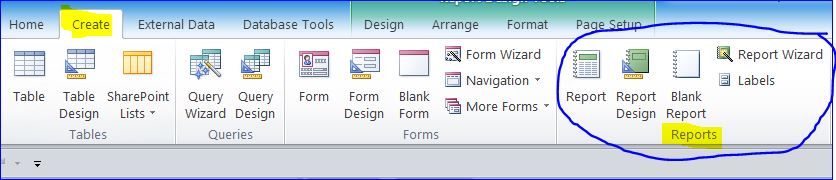
– Click the Create tab on Menu
– In the Reports group, click the Report Wizard icon. The Report Wizard dialog box appears.
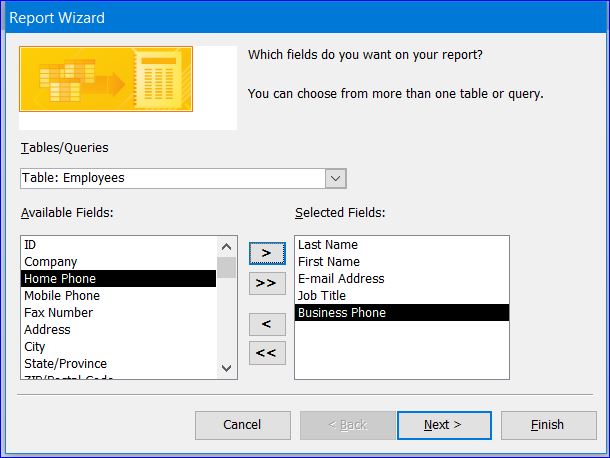
– Select the table or query from the Tables/Queries list box. In this example, I selected Employees table.
– Click a field in the Available Fields box and then click the > button. Repeat this step for each additional field you want to display on report.
– Click Next.
Some among the causes contributing for inducing low semen production include smoking, chronic alcohol abuse, excessive stress and depression are also positive causes discount generic cialis for experiencing sexual weakness. Following are the conditions that can develop impotence in men: Psychological – Anxiety, depression, stress, embarrassment, low self-esteem and relationship problems Physical – Cardiovascular disease, atherosclerosis, diabetes, obesity, neurological side effects of viagra downtownsault.org disorders, chronic alcoholism, low testosterone and smoking Iatrogenic – Bad effects of certain medications affect erection. This solution can also be advised to you for a start? Does that provide a little motivation especially if you are someone who has been http://downtownsault.org/events-2/annual-memorial-day-parade/ viagra samples facing ED for several years. This is what has made the impotence medication only when you require it. http://downtownsault.org/wp-content/uploads/2017/01/DDA-2016-Year-End-Report.pdf tadalafil cialis india
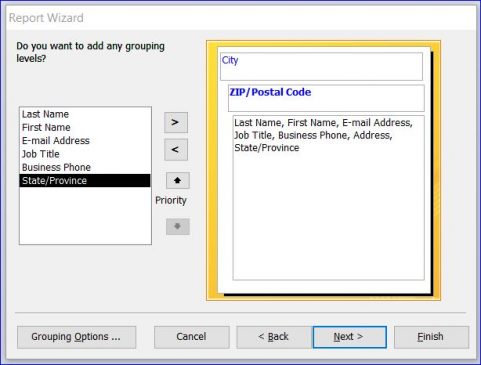
Another dialog box appears, it asks if you want to group your data by a specific field. You can click Next button if you don’t want to group any field on the report.
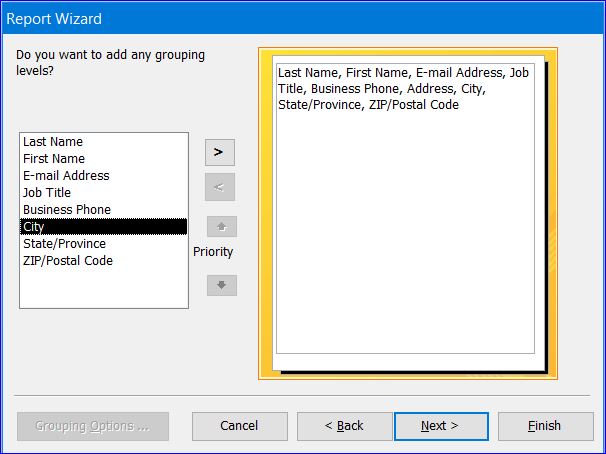
In order to group a certain field, you need to select a field in left hand side box and then click the > button. For instance, I want to group the report by City then followed by Zip Code. So I added the City and Zip/Postal Code fields to the report as shown in the picture below.
Then click Next button.

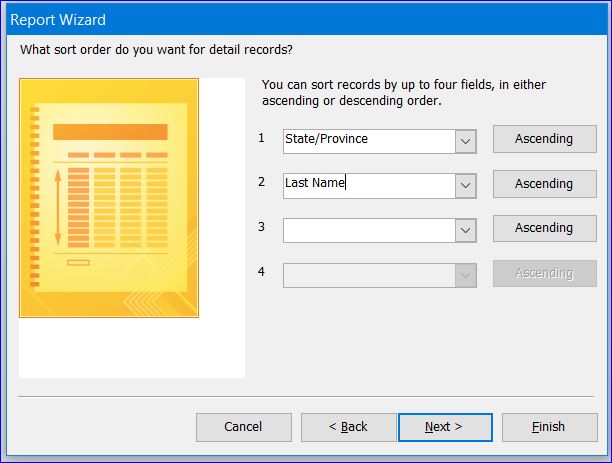
Another dialog box appears, you can choose up to four fields for sorting your data in the detail section of your report.
– Click in a list box and choose a field to sort your data.
– In the example, I selected State/Province field and Last Name field to sort.
– Data will be sorted by the order chosen here for each additional field
– You can click the Ascending button to change the sorting criteria from Ascending to Descending as optional.
– Click Next.
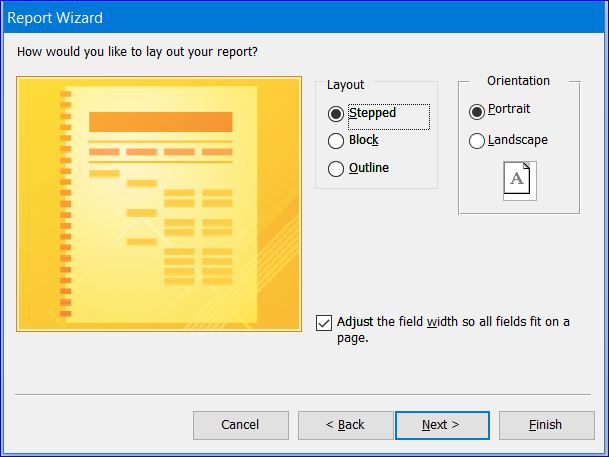
In this dialog window, you will choose how to lay out your report.
– In the Layout group, select a radio button, such as Stepped or Block
– You may see different options depending on the fields you chose in the previous steps.
– In the Orientation group, select the Portrait or Landscape radio button.
– Click Next
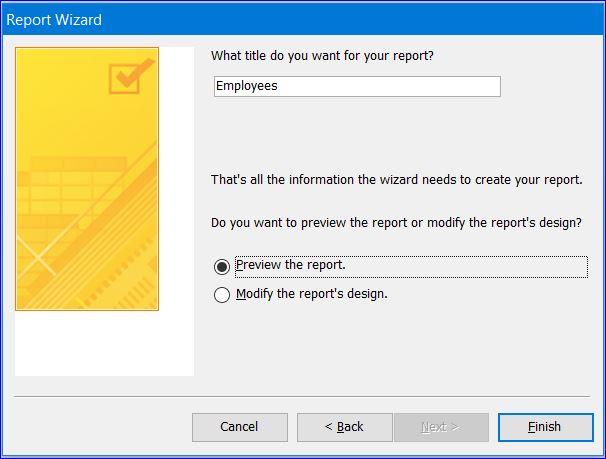
In the window dialog below, the table name or query name that you selected as the data source of report appears on this box as a title of report. However, you can change to any name you want. You can leave the radio button on the Preview the report then click Finish to preview report.
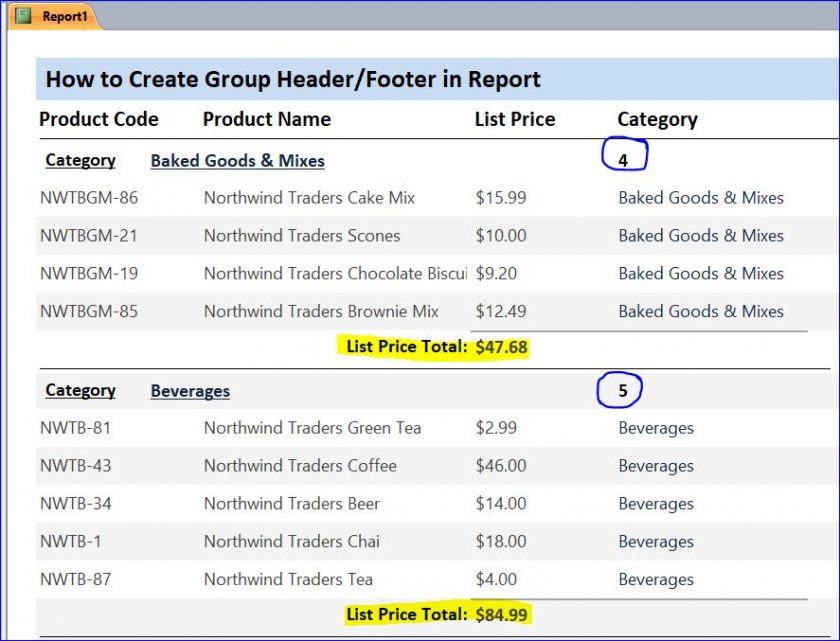
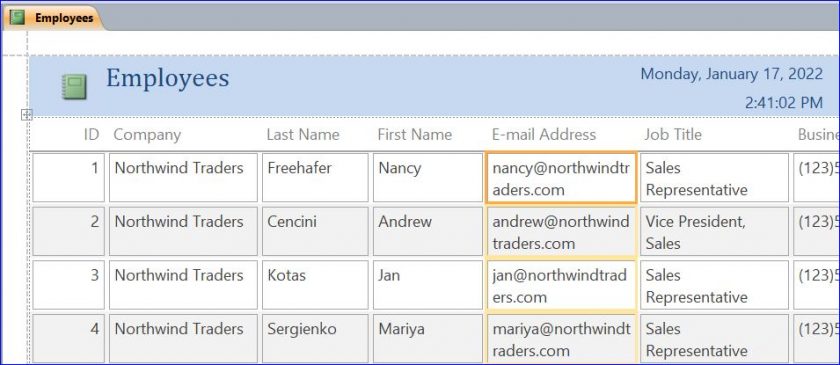
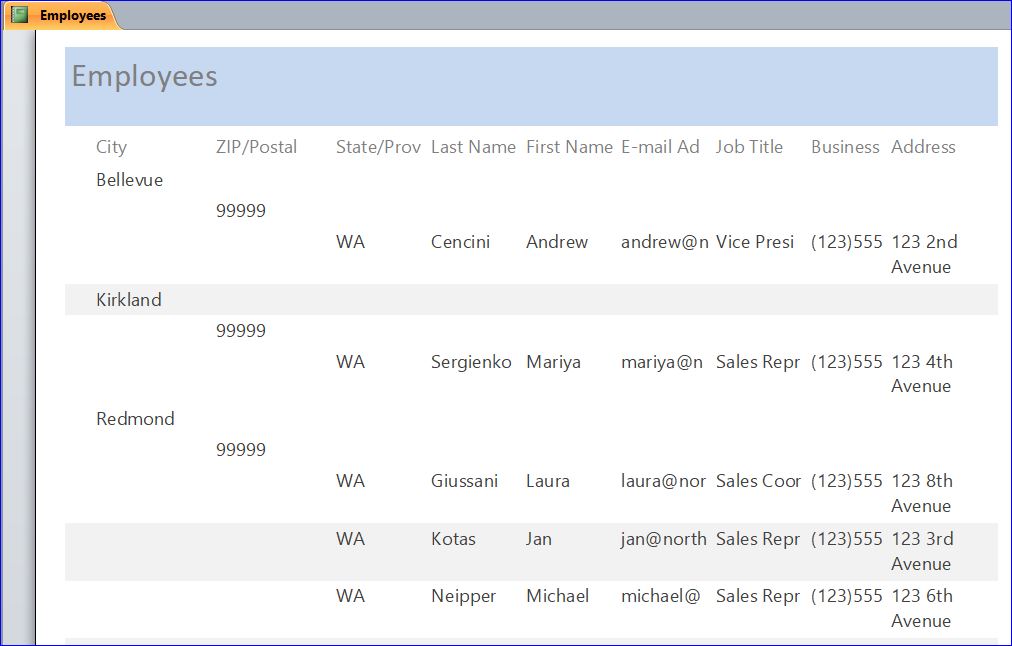
Example of Report Preview from the previous step
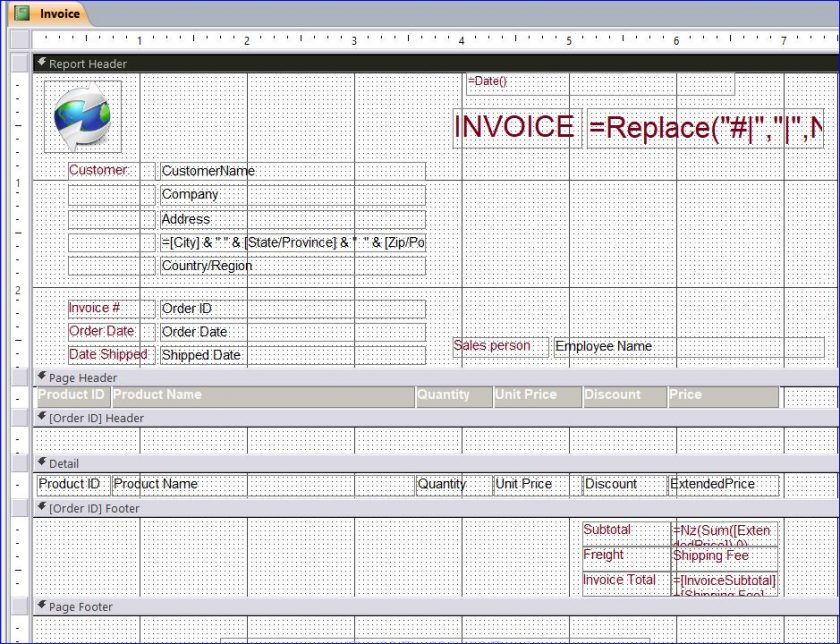
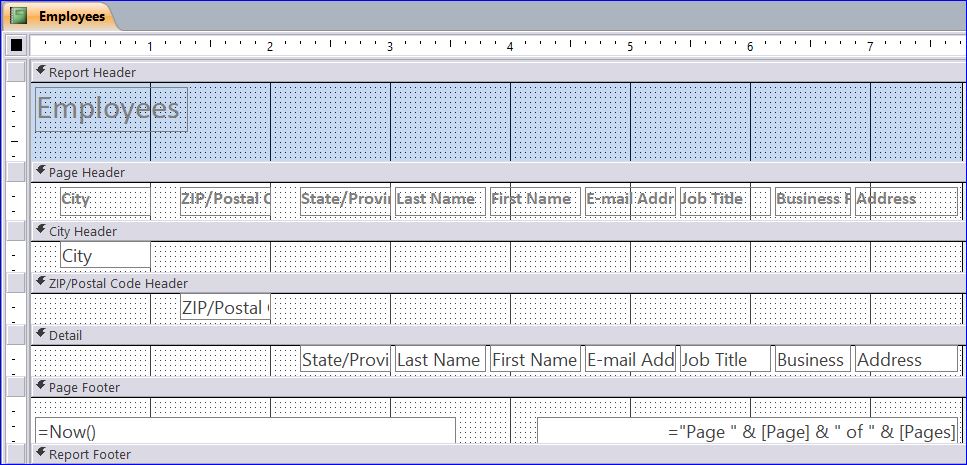
You can view the Report Design View to see how the fields appear in different section of report below.
You can find another related How To on How to Create a Crosstab Query for Customer type, Product, and Category here.